Collection of simple Excel spreadsheets for basic betting and trading calculations
Note: if prompted with alert “This file originated from an internet location and might be unsafe” when try to open downloaded Excel file, click “Enable Editing” – all downloaded files are safe, here at BetGPS.com, we don’t aim to trick you; you can check this site rating at various sources, such as one provided by Norton, one of the leading internet safety companies: click here to check BetGPS.com safety rating.
Asian Handicap calculator
This spreadsheet allows you to quickly calculate outcome of your Asian Handicap bet, for all full goal, half-goal and quarter-goal lines for both Home/Away and Total Goals (Over/Under) markets.
Just select your handicap line, enter odds and stakes, and there you are.
Excel 2007 file, 20 kB
Calculator of Double Chance and DNB Odds (Asian Handicap (0)) odds
Calculation of Double Chance and DNB (Draw No Bet, Asian Handicap (0)) odds based on 1X2 odds.
A reply to wasai’s comment, 28. December 2011:
Overround of DNB odds is not given in advance, it cannot be set before calculation. DNB odds are calculated on the basis of 1X2 odds/probabilities. So, in this example, overround is 114.22%, and odds were taken from real bookmaker’s offer. If bookmaker offered higher odds, for example, 2.40 on Home Win, 3.20 on Draw and 3.05 on Away Win, overround of DNB would be 108.30%.
Excel 2007 file, 25 kB
Calculation of AH(0) odds. Based upon Punters Lounge thread Asian handicap formulas.
Excel 2007 file, 15 kB.
Profits comparison
Comparison of profits for Full Cover Bets with or without singles, Singles and Accumulators, in a single screen, up to 8 selections.
Inspired by Punters Lounge thread Yankee Bet?.
Excel 2007 file, 160 kB
Odds conversion
Converting between decimal and fractional odds.
Excel 2007 file, 12 kB
Betting exchange hedging calculator
Calculation of back / lay stakes when trading (“Greening up” and “Redding up”).
Calculation for equal profit / loss, or calculation of profit / loss for desired stakes.
Excel 2007 file, 15 kB
The Perfect Martingale System
Spreadsheet created upon Punters Lounge thread The Perfect Martingale System:
The rules are simple. I will lay Under 1.5 Goals for a 10 stake. After one goal I will then lay Under 2.5 Goals for my 10 stake + the liability for the first bet. If another goal is scored I will lay Under 3.5 Goals for my 10 stake + all the previous liability. I will keep going until the the 87th minute. To protect me against a goal in injury time I will then lay the current correct score to cover all my liability on the Under markets.
Important note: Martingale is dangerous staking strategy that can quickly drain off your bank. Purpose of this spreadsheet is not to promote Martingale strategy, but only to provide calculation means. Please think twice before using Martingale, and if you are determined to use it, then use it carefully!
Excel 2007 file, 14 kB
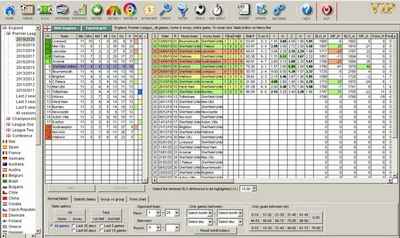
Time and sequence of goals and time of first goal
Extracts statistics on goal timing from raw data available at CGMBet.com, and occurence of second goal based on time of first goal.
Extract time and sequence of goals for all matches in specific league and season.
Excel 2007 file, ~1.9 MB.
Click here for more info and to download
Detailed instructions on how to use the spreadsheet can be found in this respective thread at Geeks Toy forum.
Excel 2007 file, 715 kB.
Furthermore, you can download entire CGMBet database used for this calculation, ending with season 2014.
Excel 2007 file, 22.5 MB.
Poisson Calculator
Poisson distribution allows calculation of probability and odds of correct score (and hence 1X2 outcome) and total goals, based on expected goals of each team.
One of the ways (though, not necessarilly the best one) to turn goal expectations into odds is Poisson distribution.
Though, you need to be aware that Poisson distribution, when applied to predict football matches, has certain flaws and limitations; there are numerous sources on that topic, and you can read, for example, one at Pinnacle before using the calculator, to understand the pitfalls of that approach!
Excel 2007 file, 20 kB.
Betting exchange Match Odds market
Simulation of profit/loss at Betfair’s Match odds market.
File created after thread at Geeks Toy forum: A Query based on Market Sports Trader Blog.
Excel 2007 file, 15 kB
Betting exchange Correct Score market
Simulation of profit/loss at Betfair’s Correct score market.
Excel 2007 file, 15 kB
Number of combinations (folds)
Calculation of number of folds (combinations) from specific number of selections
Based upon Punters Lounge thread 24 selection bet calculation.
Note: main spreadsheet purpose is calculation of number of folds, not profit, so it assumes the same odds for all selections.
Excel 2007 file, 15 kB
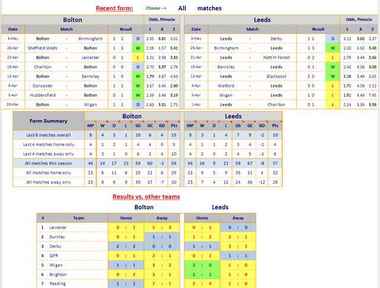
Leaning Towards Average
Strategy to evaluate expected match outcome and expected number of goals on the basis of recent team performance in comparison to “average” team performance
This strategy has been inspired by article at Understanding Uncertainty blog.
The strategy assumes that as the season goes by, average number of goals scored and conceded by each team is more accurately defined, thus allowing comparison of team performance against average performance; therefore I named this strategy Leaning Towards Average.
Spreadsheet contains example for beginning of the season in Championship 2010/2011; though, it didn’t provide initial success, and I gave it up. However, it should not be entirely ditched off based on ten rounds and one league only.
Excel 2007 file, 1.9 MB